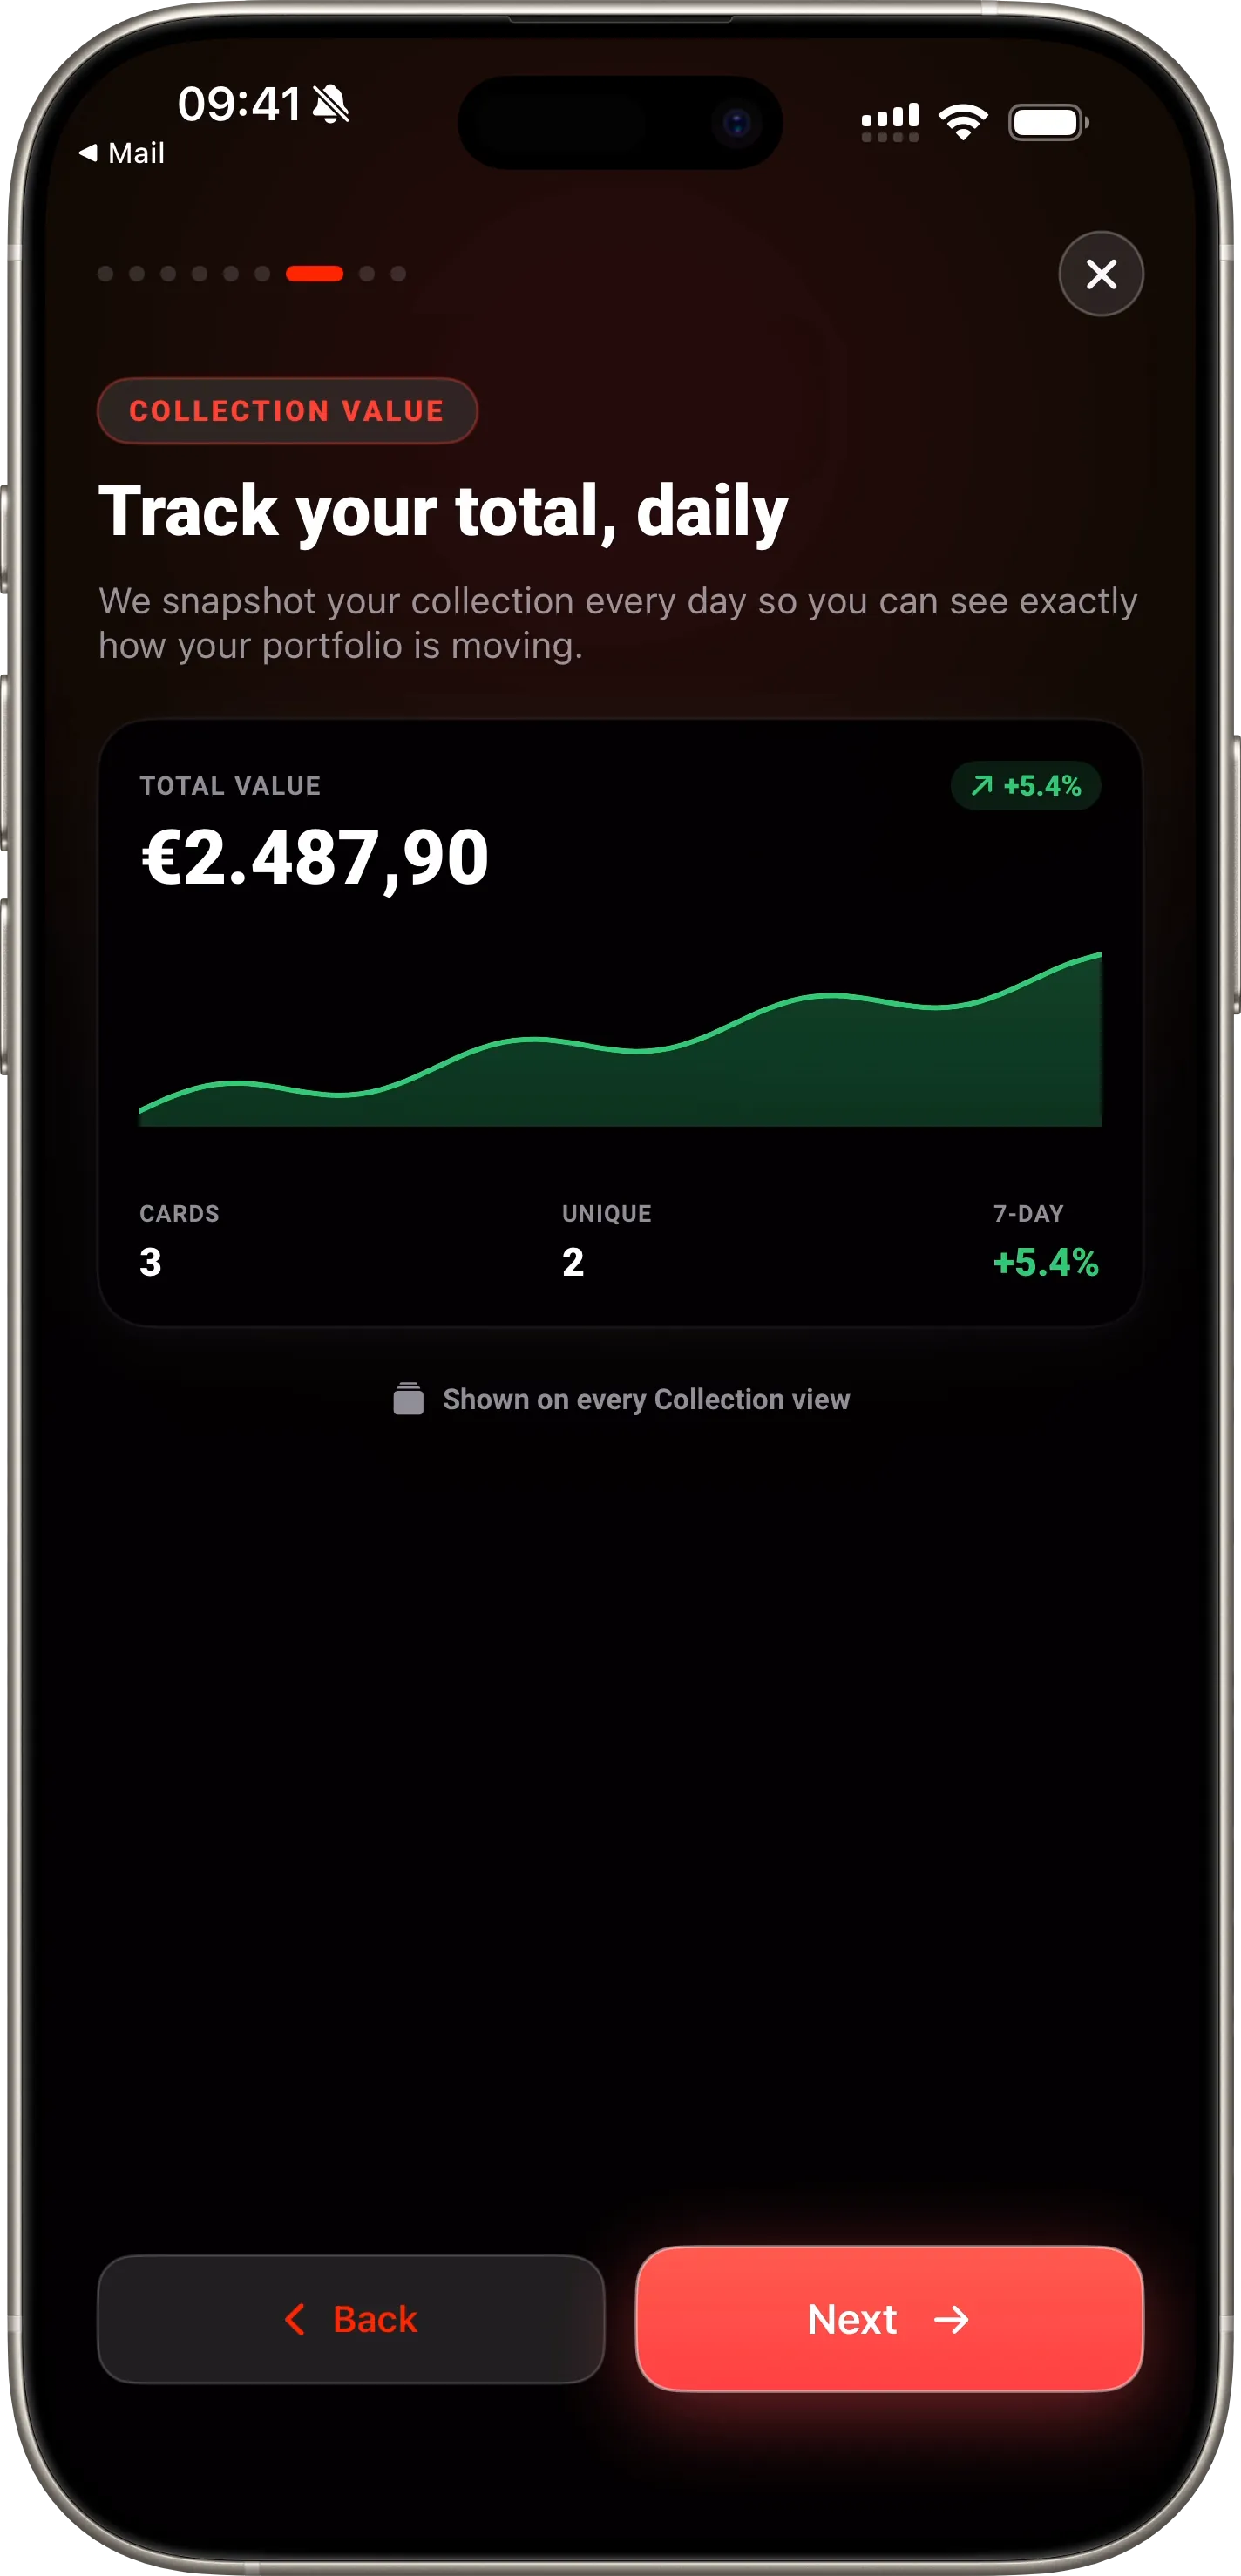
Track your total, daily

Eyevo snapshots your collection every day so you can see exactly how your portfolio is moving — without lifting a finger.

Collection Insights Feature Preview

Value over time

Watch your total collection value on a real chart — weekly, monthly, yearly, or all time — in your chosen currency.

Top movers

See which cards pushed your portfolio up or down this week, ranked by actual dollar impact.

Activity + set completion

Track how many cards you're adding each week and how close each set is to complete — all in one sheet.

The Insights screen distills the collection into the patterns that matter — biggest movers, total value over time, top sets by allocation, top Pokemon by allocation, and a daily / weekly / monthly delta breakdown. It is the screen that turns Eyevo from a card-recognition tool into a portfolio dashboard.

Movers and shakers

The Top Movers panel ranks the cards in your collection by absolute change since yesterday, since last week, and since last month. Ranking by absolute change rather than percentage filters out the noise — a 50% spike on a 50-cent common is rarely interesting, but a 5% move on a $300 chase card is.

Each mover entry links straight to the card detail page so you can drill into the price history and decide whether to act.

Allocation and concentration

Allocation breakdowns show which sets, which series, and which Pokemon hold the largest share of the collection's value. For collectors building toward a master set or hedging across eras, these views surface concentration risk — a portfolio that is 40% one set is a portfolio with a single point of failure.

The total-value-over-time chart shows the collection's combined value going back as far as the data exists, so you can tell whether you are net up or net down across reprints, market dips, and personal additions.