How to Read Pokemon Card Price Trends in 2026
A single “market price” number tells you where a card is. A trend line tells you where it’s going. If you buy, sell, or hold Pokemon cards in 2026, reading price charts is a core skill.
What a trend chart actually shows
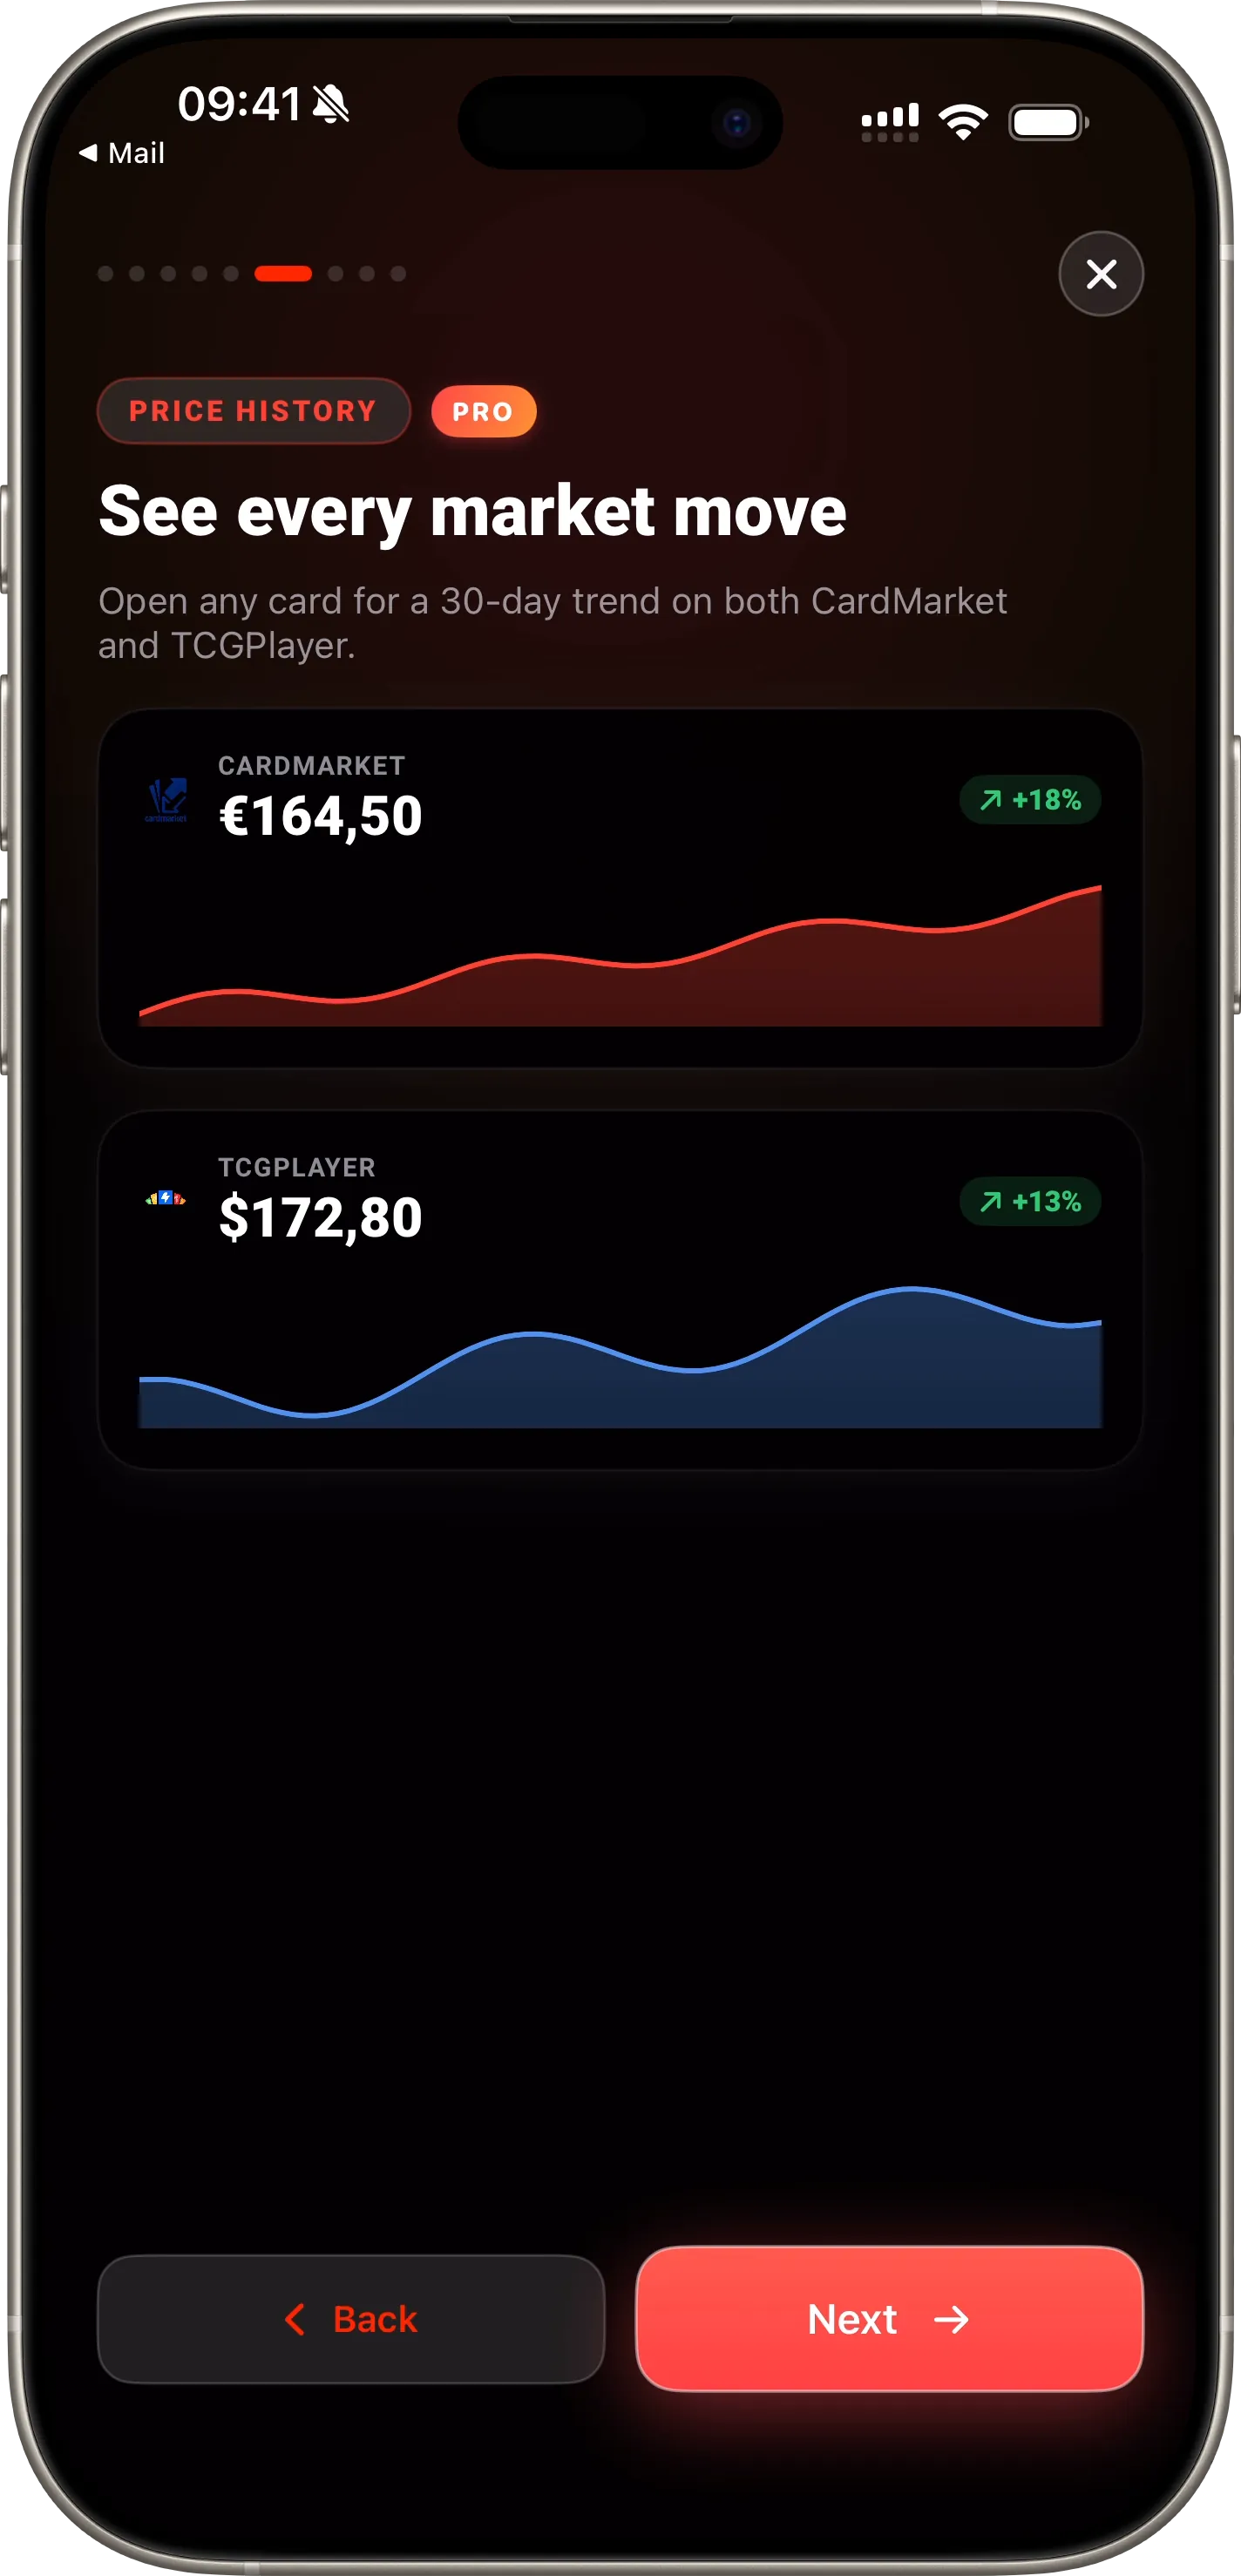
Eyevo’s 30-day chart plots real sale prices over time from CardMarket and TCGplayer. Four time ranges matter:
- 1W — short-term volatility. Use for flips.
- 1M — the “is this still moving?” view.
- 1Y — full seasonal cycle. Rotation, reprints, anniversaries.
- All — lifetime trajectory. For investment decisions.
Three patterns to recognize
- The spike — vertical jump over a few days. Usually driven by a meta shift, a content creator, or a tournament result. Sell into the spike; don’t chase it.
- The slow climb — steady uptrend over months. Reprint risk is low, demand is organic. These are holds.
- The rollover — rising, then flattening, then dropping. The top is already in. Exit if you were flipping.
Comparing CardMarket and TCGplayer
The two markets don’t always move together:
- TCGplayer leading → US-driven demand. Often content-creator spikes.
- CardMarket leading → European collector demand. Usually steadier.
- Both diverging → arbitrage opportunity if shipping math works.
How to use the scrubber
Tap and hold anywhere on the chart to read the price on any specific day. This is gold for tracking the exact cost basis on cards you bought months ago — no more guessing.
Learn more: Price History charts
Ready to scan your cards?
Download Eyevo and identify your Pokemon cards in under a second.
Pokemon TCG Card Scanner Know Exactly What It’s Worth.
Eyevo identifies the exact printing in under a second, then shows live raw, graded, and sold prices. Recognition works offline, and your collection stays on your device.